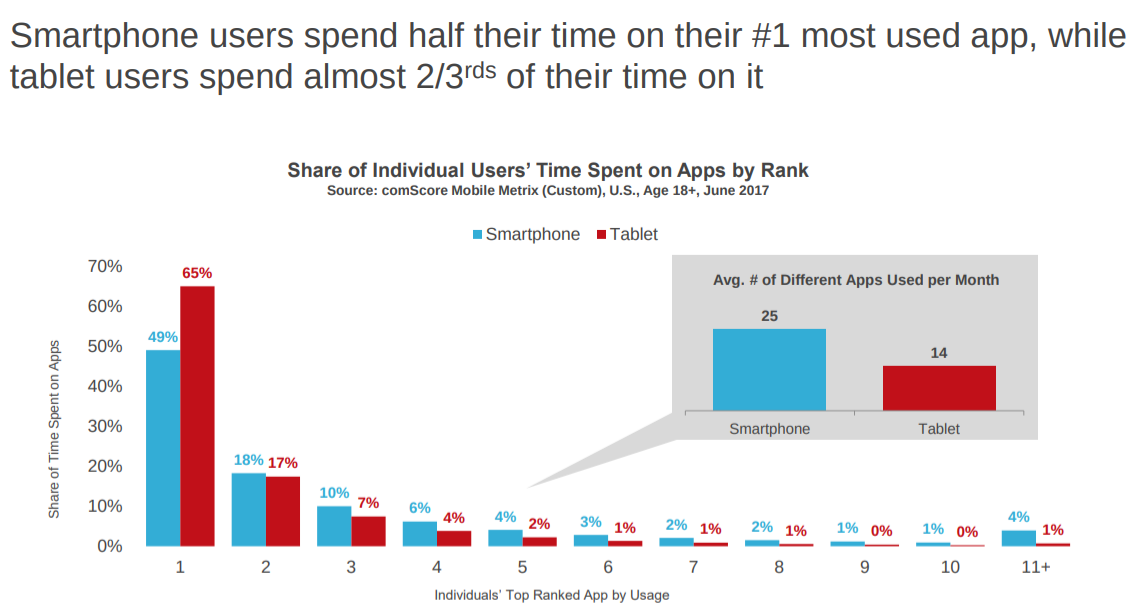
U.S. smartphone users spend nearly half their digital media time on their most-used app, with a long tail of lesser-used apps, comScore data shows. Tablet users spend 60 percent of their time on the most-used app. Some will see in such patterns more evidence of a “winner take all” pattern in applications, and therefore argue that antitrust action is needed to restore more innovation or competition in app markets.
But “winner take all” actually is a common, perhaps even expected pattern in all industries, and not just internet-based industries. The smartphone app usage pattern is an almost perfect illustration of a key principle of market share structure, which tends to be that the leader has twice the share of the second provider, which in turn has twice the share of number three.
Some might call that a “rule of three.” The point is that most markets will tend to disproportionately favor the market leader, with drastically lower shares for number two and number three.
Since market share tends to correlate with higher profit margin, leaders will tend to have greater ability to invest and retain leadership.
The U.S. app use data also tend to confirm the “winner take all” pattern in the internet app ecosystem, where the market leader commands a highly-disproportionate share of usage, earnings and revenue.
There are some interesting implications for access markets (fixed and mobile), which tend not to show the classic 60-30-10 sort of pattern. Some mobile markets have less share difference than the classic pattern would suggest, and some observers would say that means those mobile markets remain unstable, but also are competitive.
If the market share pattern should evolve in the direction of the classic 60-30-10 distribution, it is highly unlikely much disruption would be possible in the near term, as none of the other providers would have the financial strength to challenge the leader.