Mobile network speeds have not historically matched fixed network speed increases, in large part because mobile spectrum has been sharply limited, while cabled networks can, in principle, use all the spectrum typically available to all over-the-air wireless networks, plus additional spectrum in the optical domain.
Historically, higher mobile data speeds have been enabled by use of smaller cell sizes, which increase bandwidth by spectrum reuse; new allocations of spectrum with each successive mobile generation; better radio technologies and modulation techniques.
Since possible bandwidth also increases with signal frequency, the use of very high frequency millimeter waves will vastly increase capacity, where millimeter wave platforms are deployed.
Effective mobile end user experience also is powerfully affected by the widespread use of Wi-Fi as the device data access platform. As a practical matter, that means mobile device experience is dictated by Wi-Fi speed, not the speed supported by the mobile network.
All that means end user experience on mobile devices will be shaped not only by higher mobile network speeds provided by the latest generation of networks–such as 5G–but also by speed increases in the fixed network and Wi-Fi local distribution networks as well.
Nielsen’s Law of Internet Bandwidth states that a high-end user’s fixed network connection speed grows by 50 percent each year, doubling roughly every 21 months. That suggests a top-end internet access connection in 2025 will offer 10 Gbps speeds in the downstream.
But it is reasonable to assume Nielsen’s growth rates cannot continue forever, as 50 percent compounded growth without end has some physical limits (time, physics, cost, demand, substitutes). At some point, as was true with personal computer processors, parallel processing becomes the method for boosting performance, while raw processing itself loses relevance as a product differentiator.
In the consumer internet access space, that suggests both new ways of supplying bandwidth, less value produced by ever-increasing speed offers and a shift to other forms of value. At some point, mobile internet access speeds will be high enough that speed, as such, ceases to be a barrier to experience or application use.
As always, availability (coverage), latency, cost, new applications, new use cases, value bundling and device support will become more visible and important drivers of mobile value for consumers.
As the 5G standard explicitly makes clear, mobile device access includes both Wi-Fi and mobile network resources. And that, in turn, means fixed network access speeds matter directly for mobile devices, applications and user experience.
In that regard, fixed network capacity–which drives Wi-Fi capacity–directly drives mobile experience as well. With some exceptions, as for 5G fixed wireless access, where the mobile network is a direct replacement for fixed network access, user experience will not uniformly be shaped by what the mobile network can provide.
Most of the time–up to 70 percent–it is the Wi-Fi access connection speed that shapes mobile device end user experience. In that regard, Nielsen’s Law suggests the rate of change.
Nielsen’s Law predicts the top speed available for purchase, not the average or typical speed a consumer might buy. What will matter for most mobile users is the speed they experience on the home broadband plans they are willing to buy.
In other words, few customers ever buy the fastest-possible Nielsen rate services, which are almost always bought by a small fraction of customers. Instead, most consumers buy services running six times to 20 times slower than the Nielsen rate.
It has taken quite some time for customer uptake of gigabit internet access services to reach as much as eight percent share of total, for example.
Keep in mind that the first U.S. gigabit services began commercialization in 2013, so it has taken seven years for uptake to reach as much as eight percent of the installed U.S. base of fixed network internet access connections.
Most consumers buy services running between 50 Mbps and a couple of hundred megabits per second. The point is simply that fixed network speeds, which dictate Wi-Fi speeds, are not at Nielsen rates.
Cloonan’s Curve provides a way of estimating bandwidth speeds purchased by cable modem customers, in relation to the headline speed (Nielsen rate). Most customers do not typically buy the fastest-available service, as that also is typically the most-expensive tier of service. Instead, they tend to buy the mid-level service.
The caveat is that Cloonan’s Curve obviously does not apply to service providers that sell only a single tier of service, at the advertised headline rate (“gigabit only,” for example).
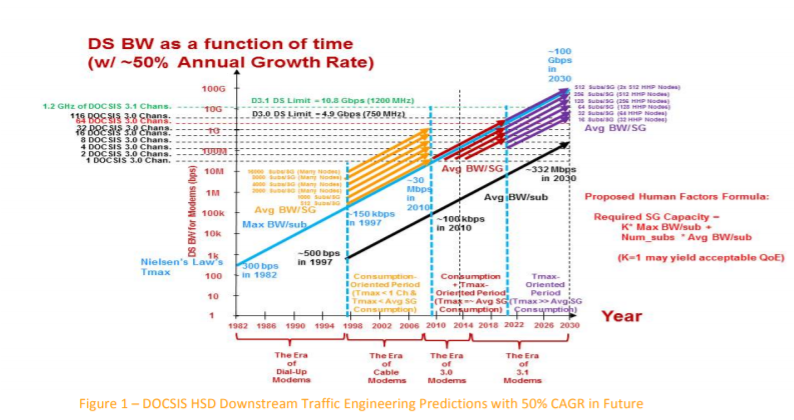
This illustration of downstream bandwidth plans actually purchased by customers suggests that although both Nielsen and Cloonan rates increase at about 50 percent per year, most customers buy services that offer six times to 20 times less speed than the fastest-available service tier.
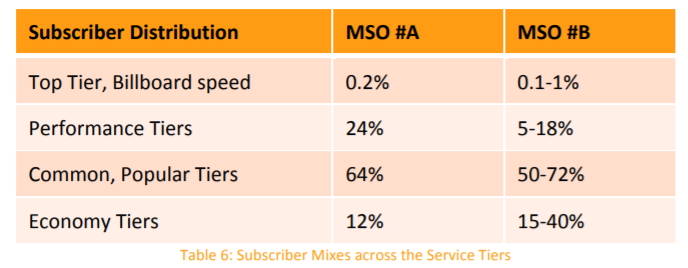
Think of the fastest tier of service (1 Gbps, for example) as the “billboard tier” that is featured in service provider advertising as the “speeds as fast as X” rate. Then consider the “common or popular tiers” as those in the middle of the offered speed ranges. Then there is an “economy tier” for customers with light usage patterns, limited app requirements or willingness to pay profiles.
That has implications for network planning, bandwidth upgrades and marketing. Internet service providers can advertise the headline speed knowing that a small percentage of customers are going to buy it.
Networks obviously must be designed to deliver the headline rate. But total bandwidth consumption, which affects the capabilities of the rest of the network, does not assume that every customer buys the headline rate service. Instead, the variable portions of the network can be designed on the assumption that most customers will, in fact, not buy the headline service.
Since speed and data consumption tend to be correlated, that affects capacity planning for backhaul, for example. Simply, the Cloonan Curve informs thinking about how much capacity must grow to support the actual mix of demand from the full set of customers, based on their actual buying patterns.
That is important to match capital investment as much as possible to the variable demands placed on the network by various customer groups.
For a cable ISP, there are other implications. At some point, it will make sense to migrate the highest-usage customers–often identical with those buying the headline service–off the hybrid fiber coax network and onto a parallel access network using fiber to the home instead.
It is common to find that the top one percent of customers generate as much as 15 percent of total network usage, for example. So moving those customers off the core network frees up considerable capacity for the rest of the customers, 90 percent of whom might be supported on the legacy access network.
That allows a longer useful life for the HFC network, as most customers will continue to buy the popular and economy tiers of service that still can be supported using HFC.
Nielsen’s Law does not account for upstream bandwidth, however. Upstream capacity tends to grow at about half the rate of downstream bandwidth, or about 25 percent per year.
Customer behavior also varies. On cable networks, the heaviest users (one percent) of customers generate as much as 47 percent of upstream bandwidth. And it often is the case that 80 percent of total upstream capacity demand is generated by just 10 percent of total users.
Those patterns might also apply to support of mobile device access.