As the U.S. spectrum auction of 3.4-GHz spectrum nears an end, $22 billion already has been bid on those assets, with an average price per MegaHertz per person of about 65 cents. Some will argue that directly increases capital investment by the winning entities. Others will agree, but enumerate those investments separately from other mobile operator capex.
How much capital investment mobile operators invest each year depends on how one counts such investments. Often, physical plant and spectrum investments are tallied separately.
Consider a CTIA report on U.S. mobile industry capital investment. Between 2016 and 2020, for example, “capex” is said to range from $25 billion to $30 billion per year.

Spending for spectrum licenses ranges is tracked separately, it appears, as it appears spectrum license spending has accelerated since 1994.
Prior to 1994, spectrum license spending might have been tracked by decade. Between 1994 and 2001 CTIA used an eight-year interval. Since 2002 CTIA uses a five-year interval.
That indicates a quickening of the tempo of license acquisitions; more competition for licenses as well as bigger spectrum allotments (more frequent auctions; more licensees; more capacity per auction).
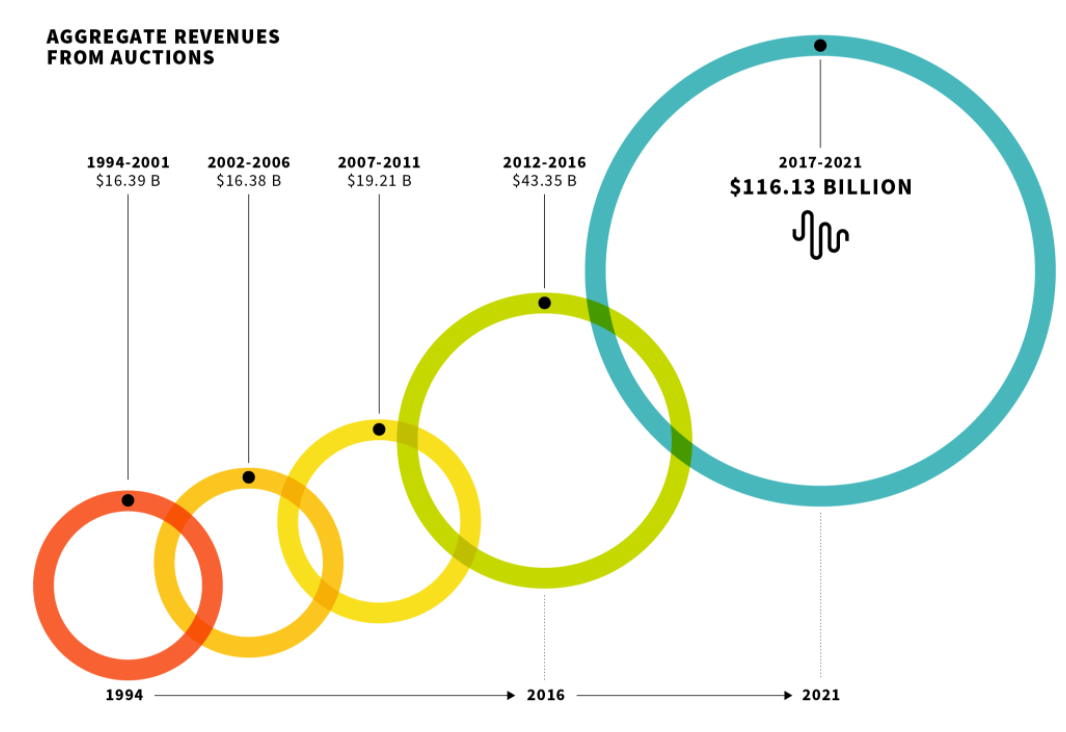
It appears CTIA, for purposes of tracking capital investment, does not include spectrum purchases in its chart on U.S. mobile industry “capital investment.” CTIA shows cumulative “capex” between 2016 and 2020 as a cumulative $138.5 billion total.
CTIA also shows spectrum licenses paid for in the 2017 to 2021 period as $116 billion. So obviously, spectrum license spending, though “capex” for accounting purposes, is separated from spending on spectrum licenses, which also is categorized as “capex” by accountants.
Standard and Poors includes spectrum licenses in the “capex” category, for example.
So actual mobile capex often is portrayed as higher or lower, depending on the assumptions. “Network capex” often is separately portrayed from “spectrum capex.” Both have grown.
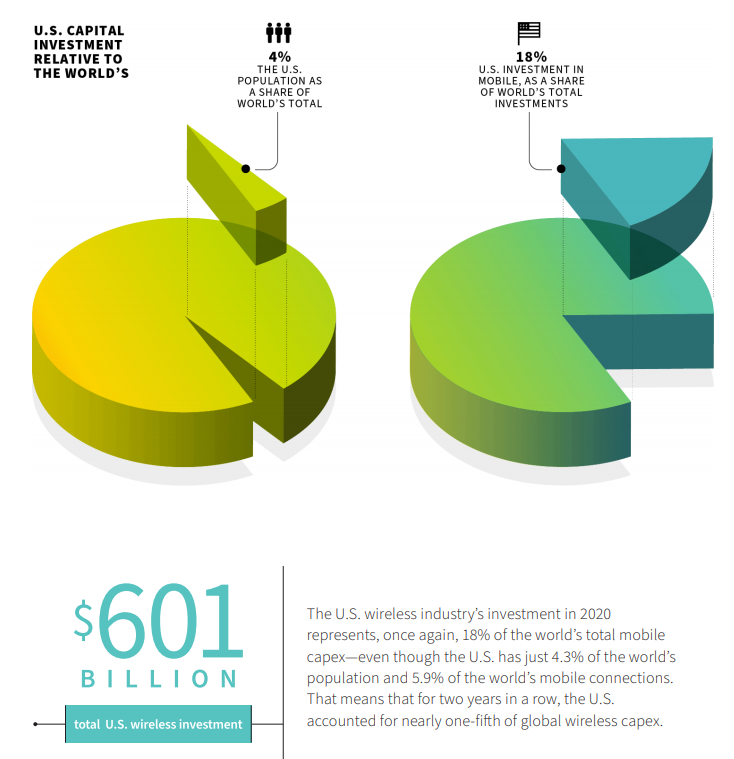
CTIA also says cumulative capex including 2001 to 2020 is $601 billion, an average of about $30 billion per year. That tends to correlate to separate tracking of network capex and spectrum license capex. At the same time, cumulative spectrum license fees are said to represent a cumulative $200 billion in spending.
Spectrum licenses represent perhaps 25 to 35 percent of mobile operator assets in the United States and perhaps 10 percent to 20 percent of assets for other mobile operators globally.
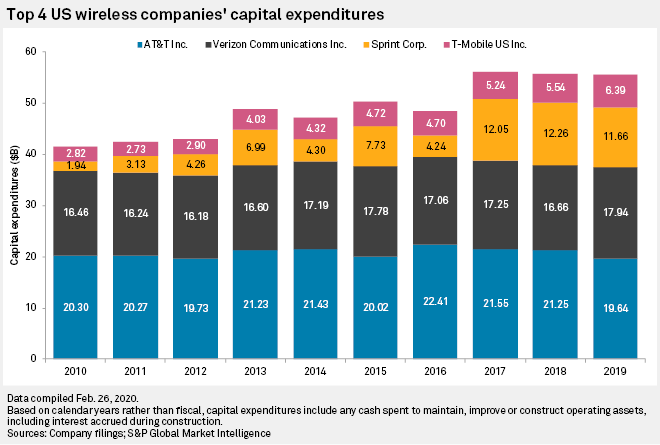
Overall, some might argue that total capex is rising. This chart from Standard and Poors Market Intelligence shows U.S. mobile operator capex (Just the three largest facilities-based providers) rising over time. As S&P includes spectrum spending in capex totals, that suggests spectrum spending is rising.
But secondary transactions also happen. Including those investments, U.S. mobile operators have cumulatively spent about $601 billion in capital investment since 1994, according to the CTIA.
Spectrum license purchases since 1994 have amounted to at least $211.5 billion, not including the cost of spectrum licenses that have traded hands in the form of direct purchases or company acquisitions and mergers.
Assume that about half of all spectrum originally acquired at auction then is resold on secondary markets, primarily as firms with those licenses are acquired by other firms. That would imply an additional $106 billion that mobile operators have spent on spectrum assets.
If so, then spectrum represents about $317.5 billion in spectrum capex, or roughly 53 percent of total capex.